Analyze risks and investigate incidents
Mosaic's Fraud Prevention integrated into your app provides real-time recommendations for sensitive actions. Designing your app to dynamically act based on these recommendations enforces immediate security response, while reviewing and analyzing risk incidents in the Mosaic Admin Portal leads to a better understanding of the overall attack landscape and improving your app security posture. This guide describes how to explore reported events, investigate fraud patterns, and address threats by continously enhancing risk assessment.
Step 1: Risk overview
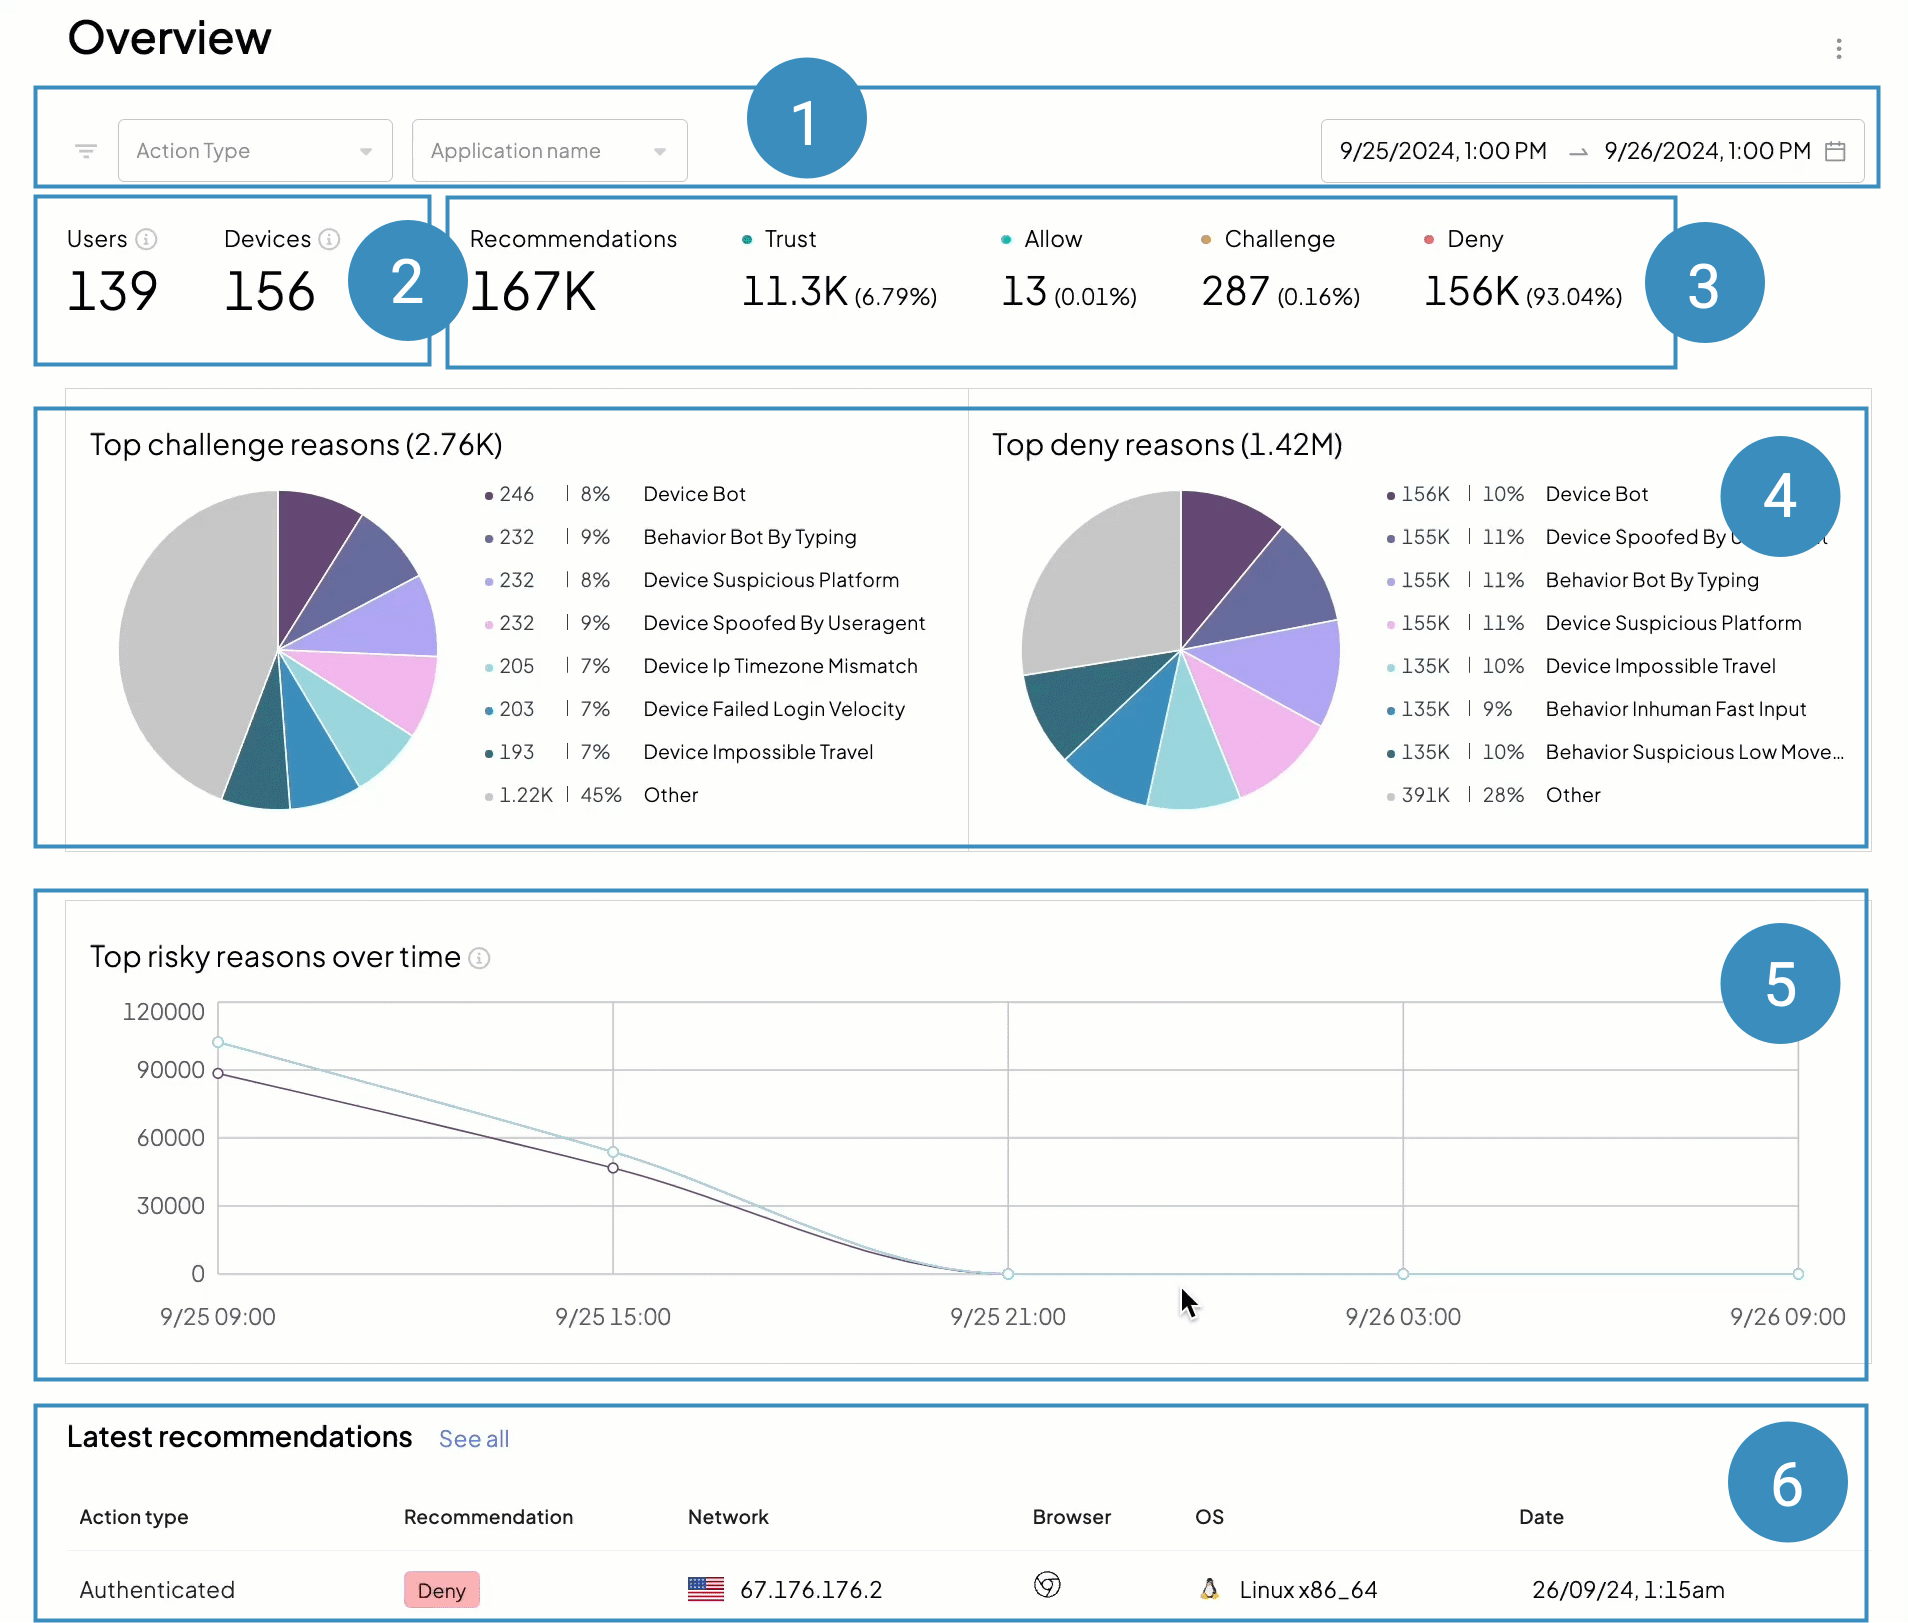
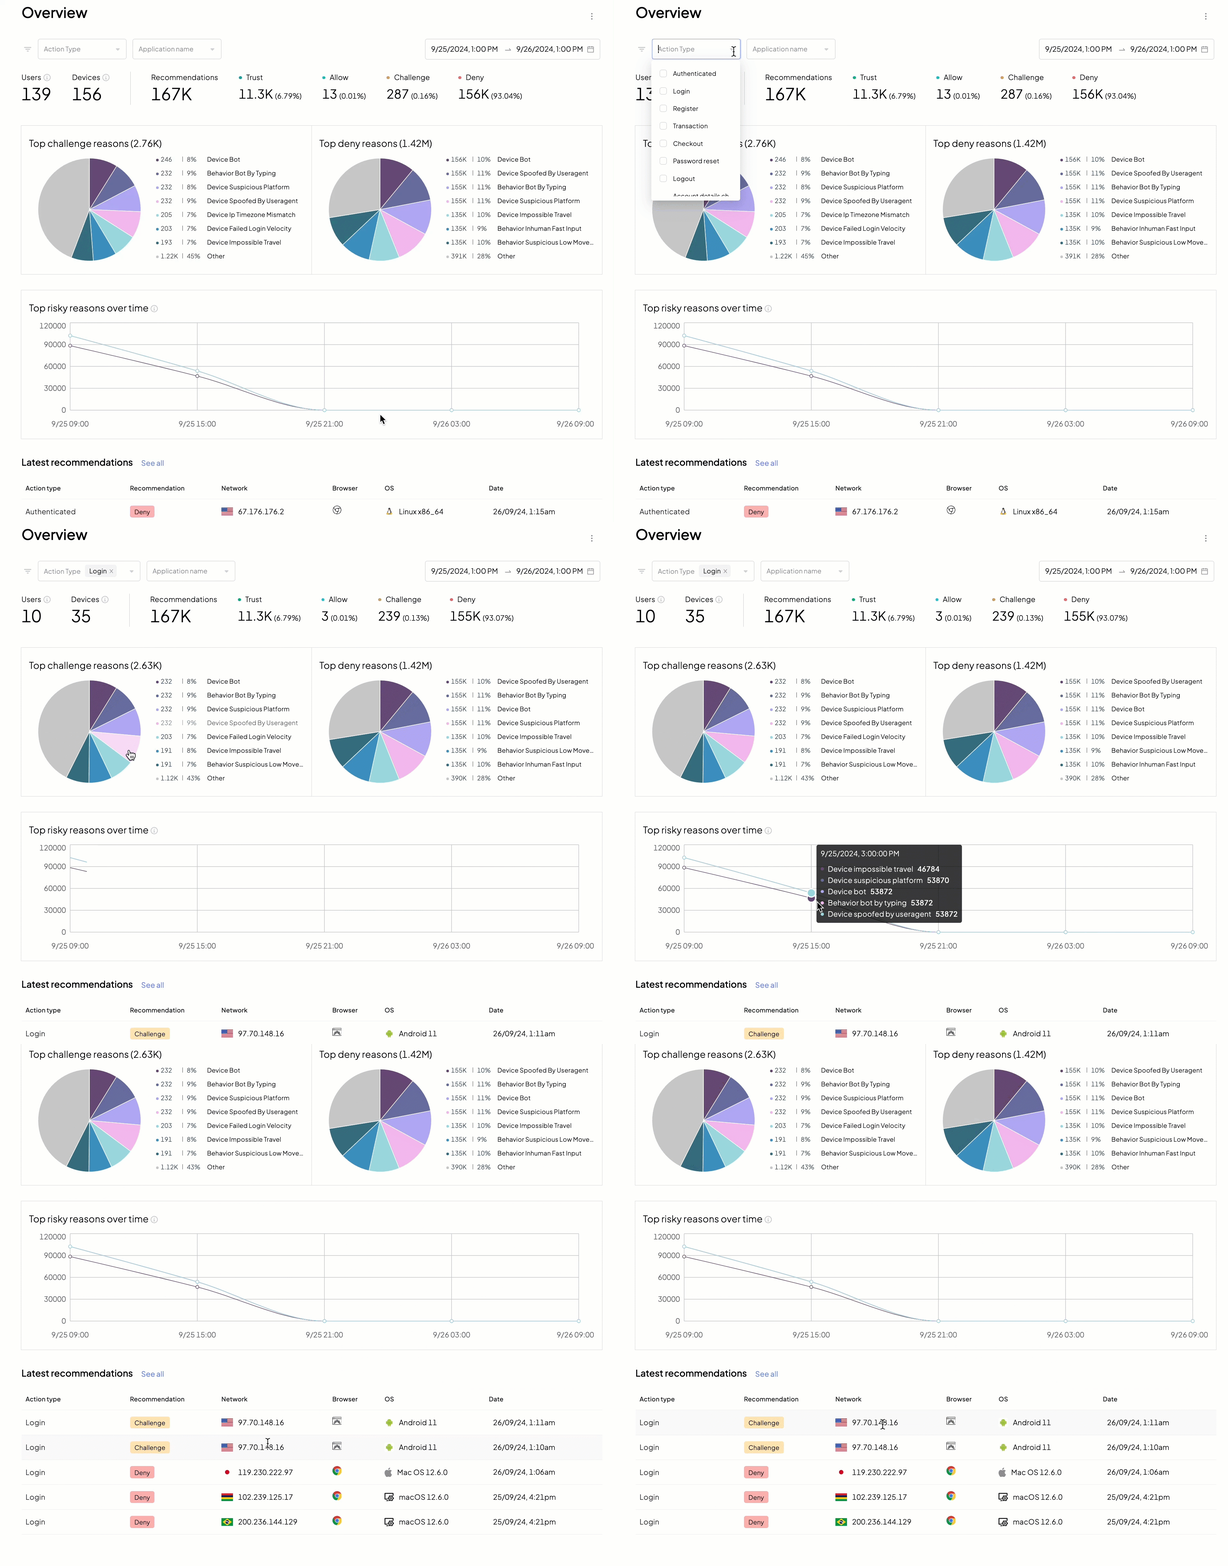
We recommend starting your daily incident review routine with the Overview page (Admin Portal > Fraud Prevention > Overview) as it provides a bird's eye view of malicious activity in your apps.
- ➊ Filters: allow narrowing down recommendations by action type, application, and timeframe
- ➋ Total number of unique devices and users
- ➌ Recommendations issued by Mosaic
- ➍ Top reasons
- ➎ Risk reasons timeline
- ➏ Latest actions reported to Mosaic
This page helps you answer high-level security questions, such as:
- How many unique users (user IDs) interacted with your app within a given timeframe?
- How many unique devices (device IDs) interacted with your app within a given timeframe?
- How many sensitive actions were reported and what recommendations were issued?
- How many users performed a certain sensitive action, such as login? What recommendations have they received?
- Does the recommendations ratio (trust / allow / challenge / deny) remain the same for different action types?
- What is the reasoning behind the Challenge recommendations? Deny recommendations?
- If you have multiple apps, how do these statistics differ from one app to another?
- What parts of your app are more vulnerable to attacks?
Step 2: Intial analysis
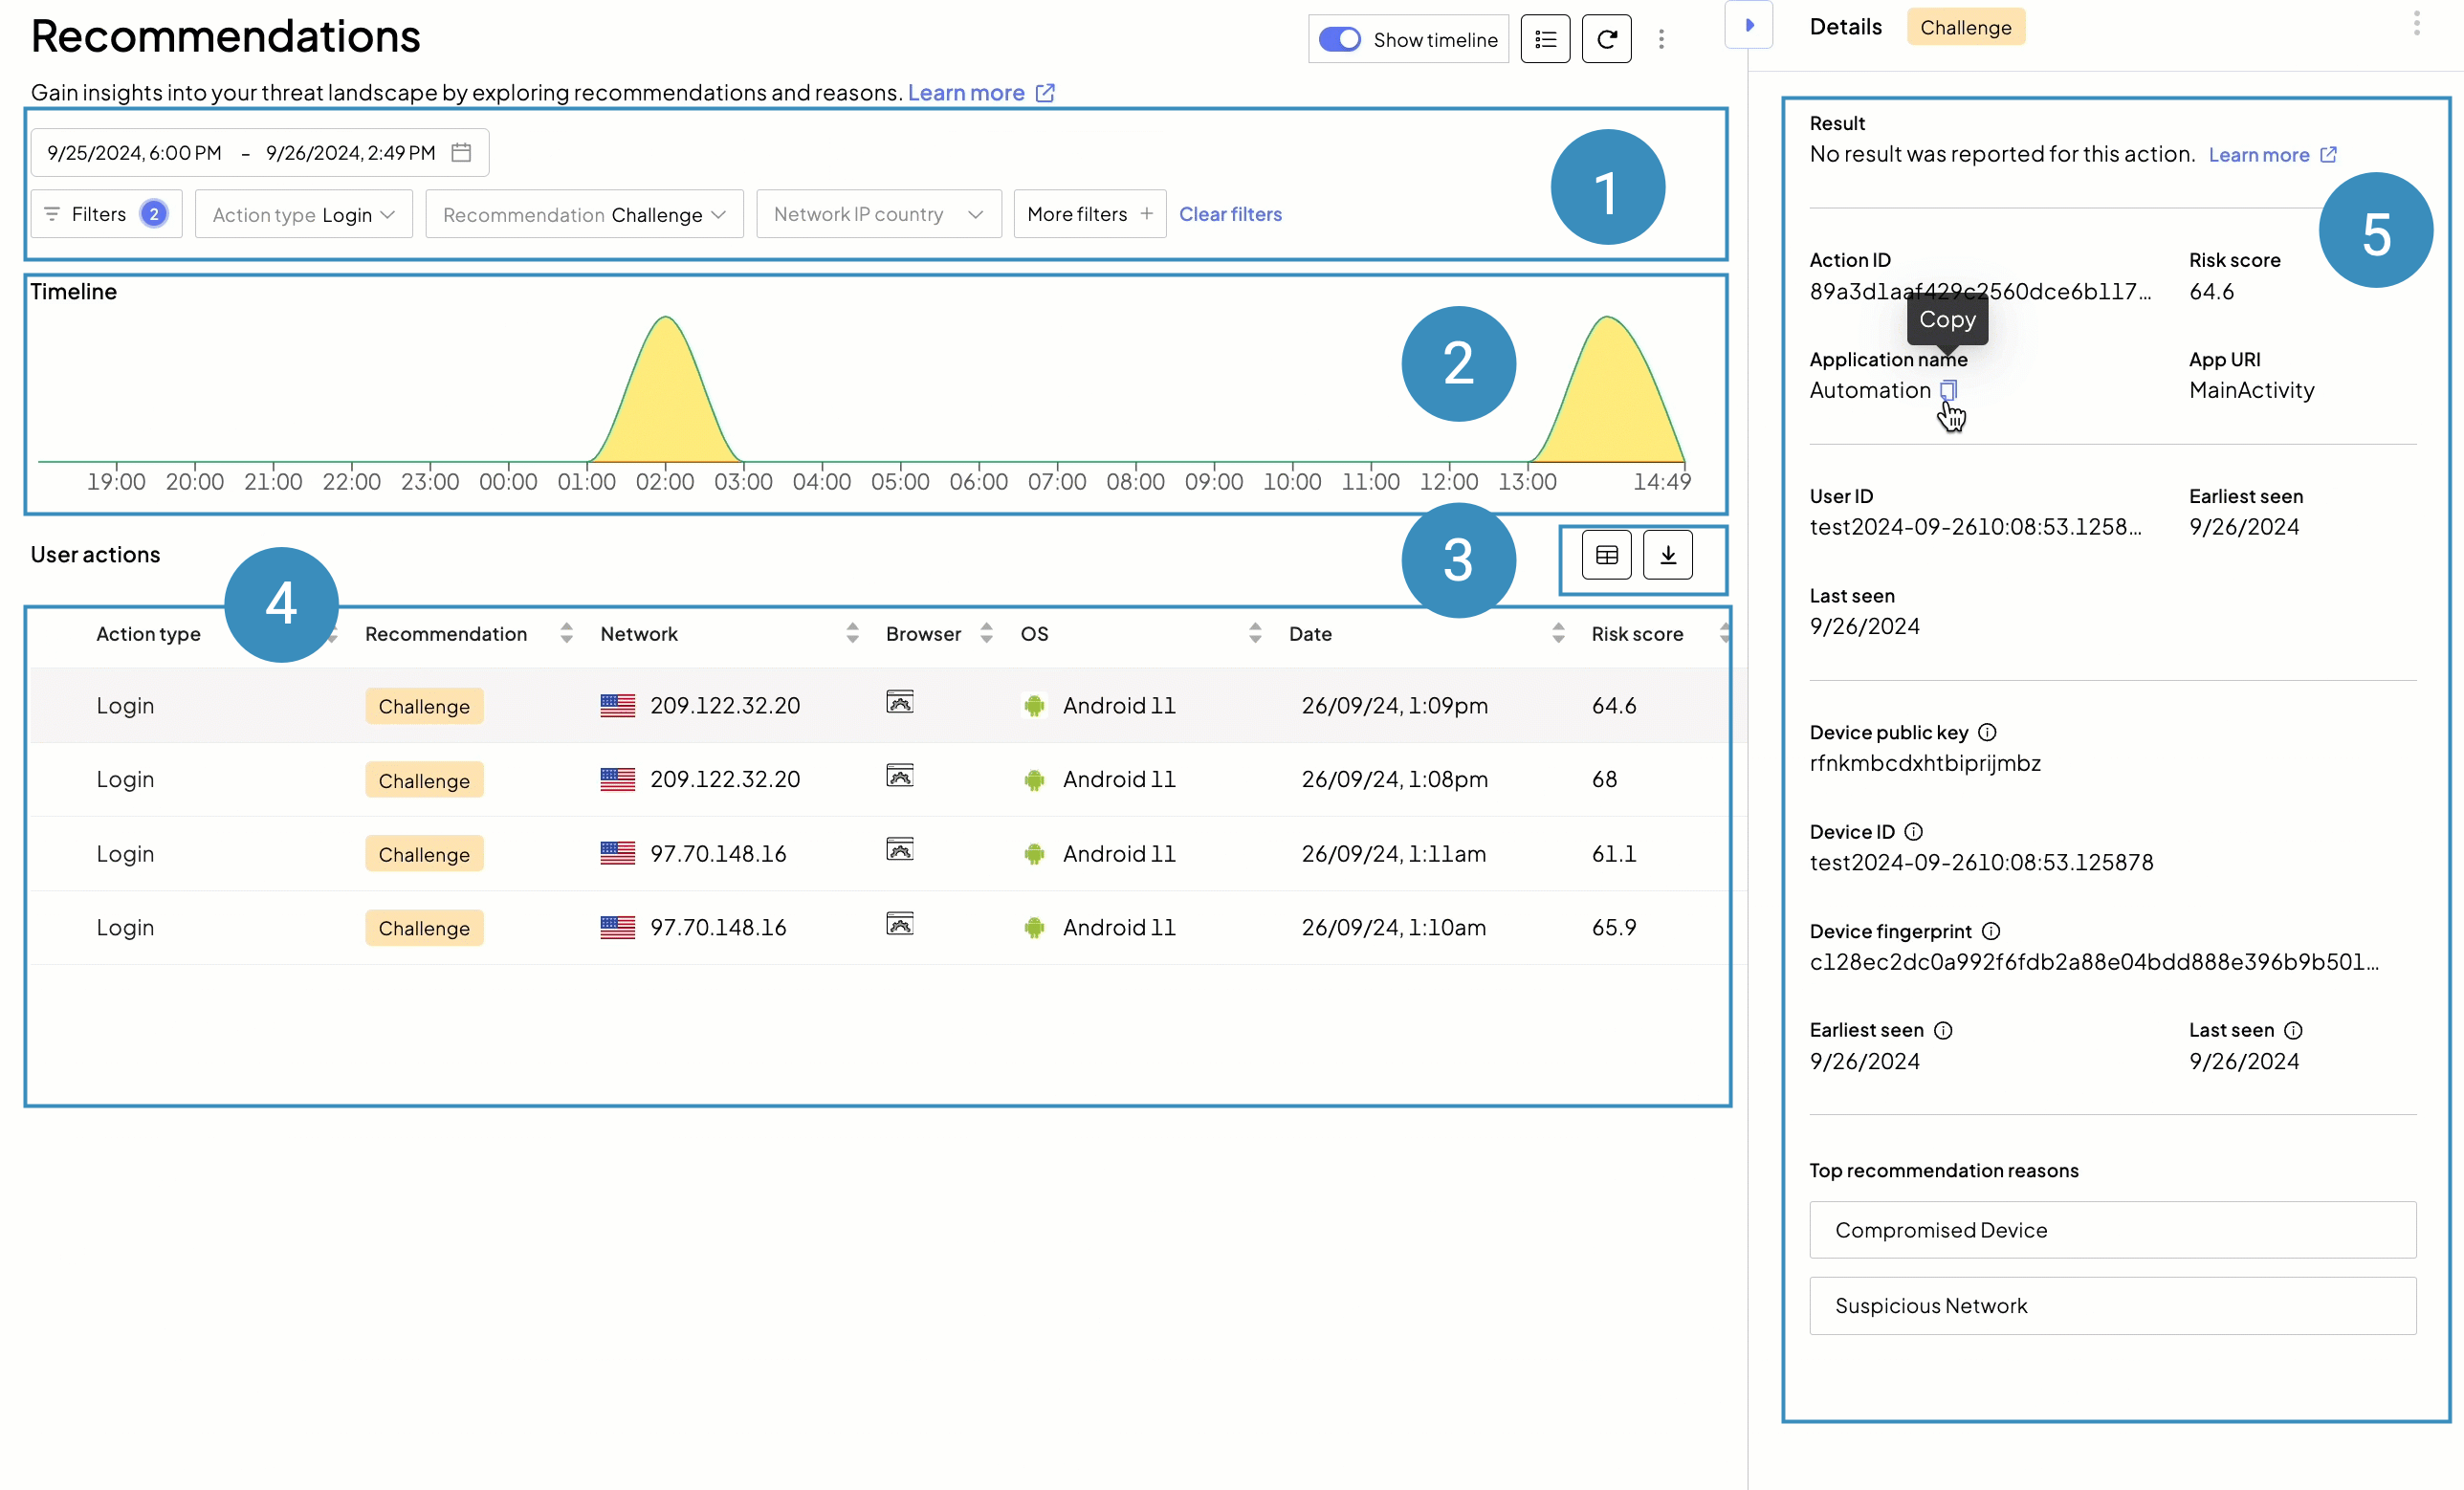
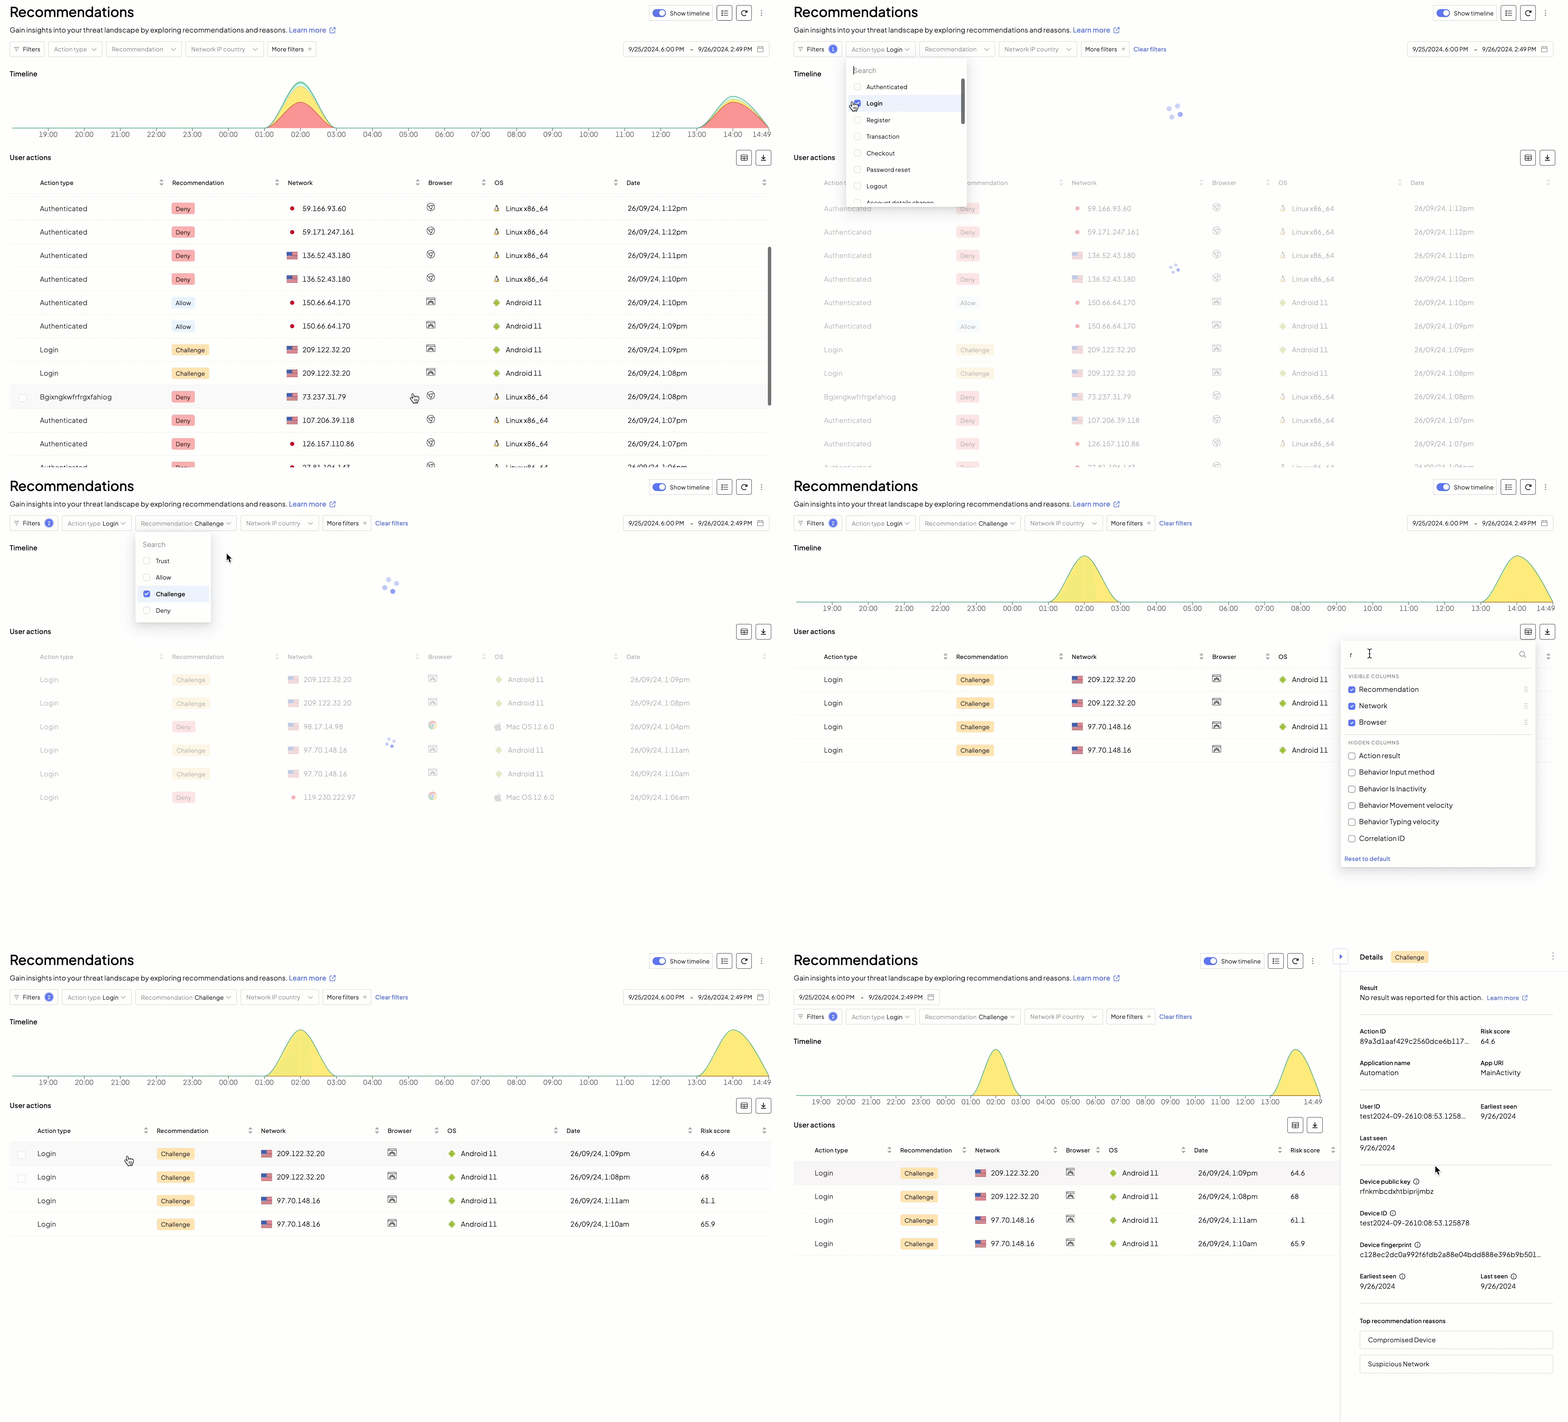
To get a better understanding of your threat landscape and activity within your applications, proceed to the Recommendations page (Admin Portal > Fraud Prevention > Recommendations). Here you'll see all the sensitive actions reported by your apps, with recommendation, network and browser details, and the date for each action.
To assist your security workflows, filter actions and add more columns to the view to see relevant risk data, such as a risk score or the total number of users per device. Expanding action details on the right provides holistic information for case analysis. You can also export the recommendations to your external analytics systems for further persistancy and offline analytics.
- ➊ Filters: allow searching for actions and their recommendations
- ➋ Action timeline
- ➌ Adding more columns and exporting data
- ➍ Recommendations list: shows user actions depending on applied filters and selected columns
- ➎ Recommendation details: shows a full action record
For initial risk analysis, try answering these questions:
- How does the timeline look? Are there any spikes in malicious activity?
- What actions got denied? Challenged? Allowed? Trusted?
- What is the risk score for a specific event?
- Does malicious traffic originate from the same IP address? Country?
- Are denied actions associated with the same device fingerprint or user ID?
- What reasons contribute to an action being denied or allowed?
- Are there any labels applied?
Step 3: In-depth investigation
For thorough inspection and risk tracing, on the Recommendations page, select an action and switch to the Investigate mode.
First, pay attention to the Overview tab, it presents a summary of the action you selected for investigation, with all the reasons, context, risk signals, etc., detected by Mosaic. Next, proceed to the Entity analysis tab, to delve into user entity and behavior analytics (UEBA). Depending on the entity type you select (user, network, or device), you can discover and review related devices, users, IP addresses, etc. and see analytics data. If some entity catches your attention, open it in a new tab to check other actions associated with it.
- ➊ Action recap
- ➋ Main area changes depending on the tab specified (Overview, Entity analysis, Raw data) and can include timelines, related users, IP addresses, reasons, and many more
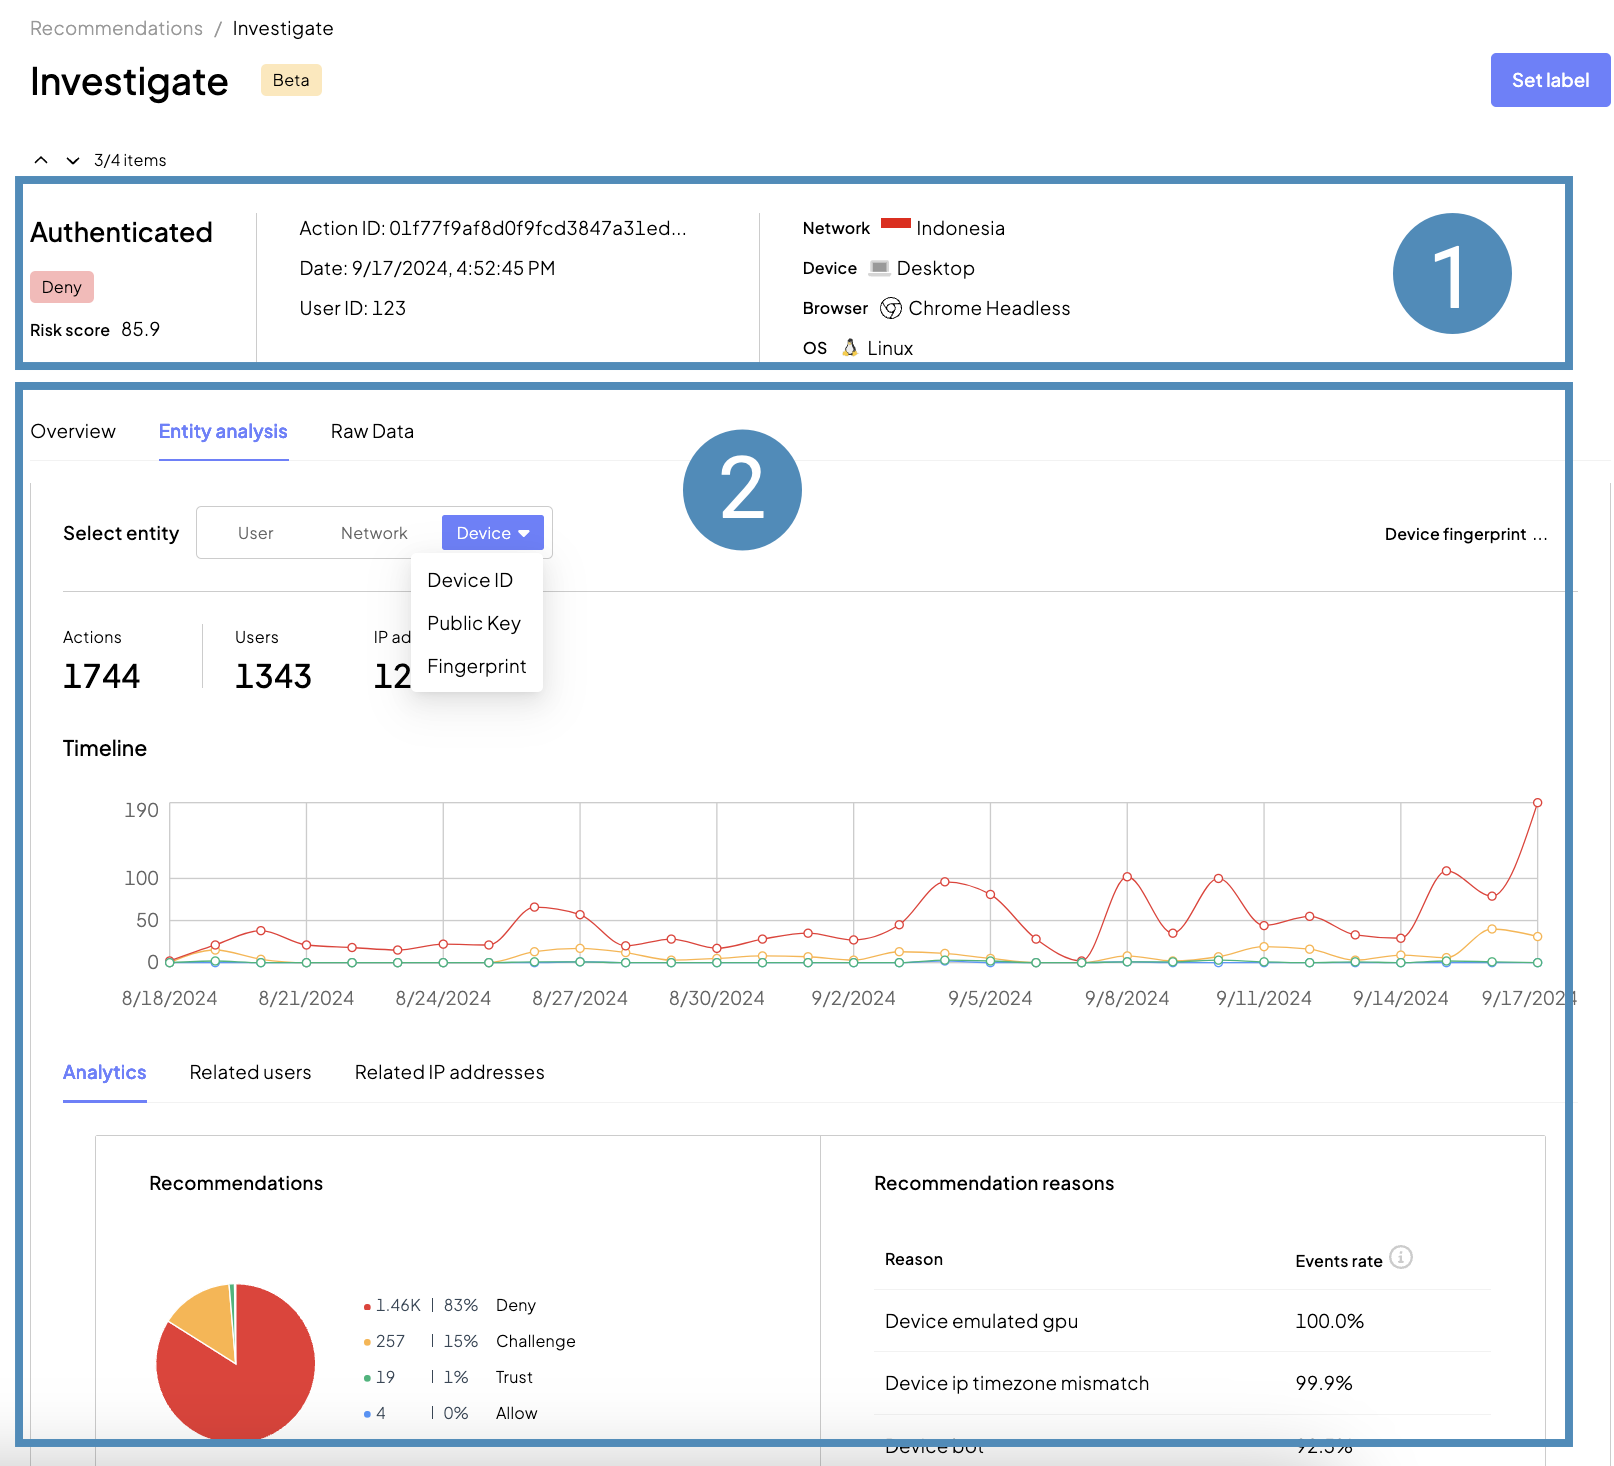
For example, the investigation mode will be helpful when you need to:
- Distinguish legitimate and malicious users — look for other fraud actions related to this account
- Explain why the action was marked as risky — on the Overview tab, review the reasons. Are there any rule in place?
- Understand specific details related to fraud events — on the Overview tab, verify if VPN or TOR was in use, anonymizer enabled, proxy configured, etc.
- Identify malicious and compromised devices — on the Entity analysis tab, check if the device fingerprint is associated with other denied actions
- Recognize a device after it was reset and check its reputation — for a device with a new device ID, you can confirm its identity by checking its device fingerprint
- Detect location anomalies — check if the device ID or user ID generates events from various locations
Step 4: Security insights
Proceed to Security Insights to examine fraud rings and fraud campaigns that represent multiple entities involved in similar activities. This view allows you to "zoom out" and identify patterns in real-time. For details, see this guide.
Step 5: Fraud prevention
Once you have reviewed and investigated risks, apply remediation controls as needed. For example,
- Assign recommendations to your security personnel for further review
- Organize recommendations into lists to process them in a timely manner
- Mitigate risks, for example by creating an automated workflow or by manually blocking a device
Circle back and improve Mosaic's Fraud Prevention with the outcome of your investigation:
- Create rules to always allow or deny specific devices, IP addresses, etc.
- Apply labels to adjust our short-term and long-term recommendation strategy
- Fine-tune detection sensitivity to add more weight to factors that matter to you